MPAndroidChart

源码

https://github.com/PhilJay/MPAndroidChart

使用说明

https://www.jianshu.com/p/185e50a70aa7
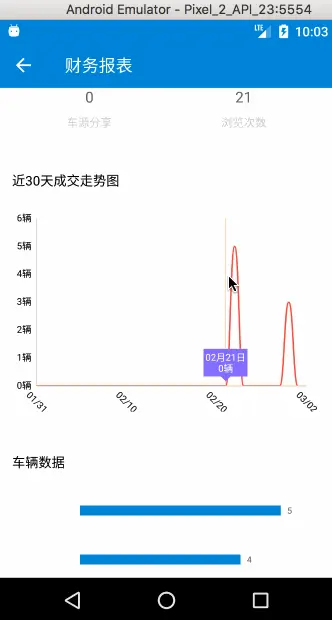
效果图

img

布局

1
2
3
4
5
6
7
8
<com.github.mikephil.charting.charts.LineChart
android:id="@+id/lineChart"
android:layout_width="match_parent"
android:layout_marginLeft="@dimen/activity_horizontal_margin"
android:layout_marginRight="@dimen/activity_horizontal_margin"
android:layout_marginBottom="@dimen/activity_horizontal_margin"
android:layout_height="220dp"
android:layout_centerInParent="true"/>

代码

1
2
3
4
5
6
7
8
9
10
11
12
13
14
15
16
17
18
19
20
21
22
23
24
25
26
27
28
29
30
31
32
33
34
35
36
37
38
39
40
41
42
43
44
45
46
47
48
49
50
51
52
53
54
55
56
57
58
59
60
61
62
63
64
65
66
67
68
69
70
71
72
73
74
75
76
77
78
79
80
81
82
83
84
85
86
87
88
89
90
91
92
93
94
95
96
97
98
99
100
101
102
103
104
105
106
lineChart = (LineChart) findViewById(R.id.lineChart);
initLineChart(/**数据集**/);

/**
* 初始化曲线图表
*
* @param list 数据集
*/
private void initLineChart(final List<Integer> list)
{
//显示边界
lineChart.setDrawBorders(false);
//设置数据
List<Entry> entries = new ArrayList<>();
for (int i = 0; i < list.size(); I++)
{
entries.add(new Entry(i, (float) list.get(i)));
}
//一个LineDataSet就是一条线
LineDataSet lineDataSet = new LineDataSet(entries, "");
//线颜色
lineDataSet.setColor(Color.parseColor("#F15A4A"));
//线宽度
lineDataSet.setLineWidth(1.6f);
//不显示圆点
lineDataSet.setDrawCircles(false);
//线条平滑
lineDataSet.setMode(LineDataSet.Mode.HORIZONTAL_BEZIER);
//设置折线图填充
// lineDataSet.setDrawFilled(true);
LineData data = new LineData(lineDataSet);
//无数据时显示的文字
lineChart.setNoDataText("暂无数据");
//折线图不显示数值
data.setDrawValues(false);
//得到X轴
XAxis xAxis = lineChart.getXAxis();
//设置X轴的位置(默认在上方)
xAxis.setPosition(XAxis.XAxisPosition.BOTTOM);
//设置X轴坐标之间的最小间隔
xAxis.setGranularity(1f);
//设置X轴的刻度数量,第二个参数为true,将会画出明确数量(带有小数点),但是可能值导致不均匀,默认(6,false)
xAxis.setLabelCount(list.size() / 6, false);
//设置X轴的值(最小值、最大值、然后会根据设置的刻度数量自动分配刻度显示)
xAxis.setAxisMinimum(0f);
xAxis.setAxisMaximum((float) list.size());
//不显示网格线
xAxis.setDrawGridLines(false);
// 标签倾斜
xAxis.setLabelRotationAngle(45);
//设置X轴值为字符串
xAxis.setValueFormatter(new IAxisValueFormatter()
{
@Override
public String getFormattedValue(float value, AxisBase axis)
{
int IValue = (int) value;
CharSequence format = DateFormat.format("MM/dd",
System.currentTimeMillis()-(long)(list.size()-IValue)*24*60*60*1000);
return format.toString();
}
});
//得到Y轴
YAxis yAxis = lineChart.getAxisLeft();
YAxis rightYAxis = lineChart.getAxisRight();
//设置Y轴是否显示
rightYAxis.setEnabled(false); //右侧Y轴不显示
//设置y轴坐标之间的最小间隔
//不显示网格线
yAxis.setDrawGridLines(false);
//设置Y轴坐标之间的最小间隔
yAxis.setGranularity(1);
//设置y轴的刻度数量
//+2:最大值n就有n+1个刻度,在加上y轴多一个单位长度,为了好看,so+2
yAxis.setLabelCount(Collections.max(list) + 2, false);
//设置从Y轴值
yAxis.setAxisMinimum(0f);
//+1:y轴多一个单位长度,为了好看
yAxis.setAxisMaximum(Collections.max(list) + 1);

//y轴
yAxis.setValueFormatter(new IAxisValueFormatter()
{
@Override
public String getFormattedValue(float value, AxisBase axis)
{
int IValue = (int) value;
return String.valueOf(IValue);
}
});
//图例:得到Lengend
Legend legend = lineChart.getLegend();
//隐藏Lengend
legend.setEnabled(false);
//隐藏描述
Description description = new Description();
description.setEnabled(false);
lineChart.setDescription(description);
//折线图点的标记
MyMarkerView mv = new MyMarkerView(this);
lineChart.setMarker(mv);
//设置数据
lineChart.setData(data);
//图标刷新
lineChart.invalidate();
}

自定义折线图标记

1
2
3
4
5
6
7
8
9
10
11
12
13
14
15
16
17
18
19
20
21
22
23
24
25
26
27
28
29
30
31
32
public class MyMarkerView extends MarkerView
{

private TextView tvContent;
private DecimalFormat format = new DecimalFormat("##0");

public MyMarkerView(Context context) {
super(context, R.layout.layout_markerview);//这个布局自己定义
tvContent = (TextView) findViewById(R.id.tvContent);
}

//显示的内容
@Override
public void refreshContent(Entry e, Highlight highlight) {
tvContent.setText(format(e.getX())+"\n"+format.format(e.getY())+"辆");
super.refreshContent(e, highlight);
}

//标记相对于折线图的偏移量
@Override
public MPPointF getOffset() {
return new MPPointF(-(getWidth() / 2), -getHeight());
}

//时间格式化(显示今日往前30天的每一天日期)
public String format(float x)
{
CharSequence format = DateFormat.format("MM月dd日",
System.currentTimeMillis()-(long) (30-(int)x)*24*60*60*1000);
return format.toString();
}
}

注意的点

  1. 当图表放在scrollview或者listview中,会发现上下不能缩放,出现滑动冲突,解决方法如下
1
2
3
4
5
6
7
8
9
10
11
12
13
14
15
16
17
18
19
20
21
22
23
//解决滑动冲突
lineChart.setOnTouchListener(new View.OnTouchListener()
{
@Override
public boolean onTouch(View v, MotionEvent event)
{
switch (event.getAction())
{
case MotionEvent.ACTION_DOWN:
{
scrollview.requestDisallowInterceptTouchEvent(true);
break;
}
case MotionEvent.ACTION_CANCEL:
case MotionEvent.ACTION_UP:
{
scrollview.requestDisallowInterceptTouchEvent(false);
break;
}
}
return false;
}
});
  1. X轴的标注显示不完整
    这里要注意
    lineChart.setData(data);//设置数据
    这个方法一定要放在最后

https://zhuanlan.zhihu.com/p/22134046

HorizontalBarChart圆角

https://blog.csdn.net/qq_40129067/article/details/108799871

HorizontalBarChartRenderer.java 中

1
2
3
4
5
//找到
//c.drawRect(buffer.buffer[j], buffer.buffer[j + 1], buffer.buffer[j + 2],buffer.buffer[j + 3], mRenderPaint);
//改成
RectF rectF=new RectF(buffer.buffer[j], buffer.buffer[j + 1], buffer.buffer[j + 2],buffer.buffer[j + 3]);
c.drawRoundRect(rectF,(float)90,(float)90,mRenderPaint);

注意:

需设置

  1. chart.getAxisLeft().setEnabled(true);

  2. chart.setFitBars(true);